Define a one-line R function FUN that provides the following output:
FUN(seq(from = 0, to = 20, by = 0.1))
FUN(seq(from = 0, to = 100, by = 0.1))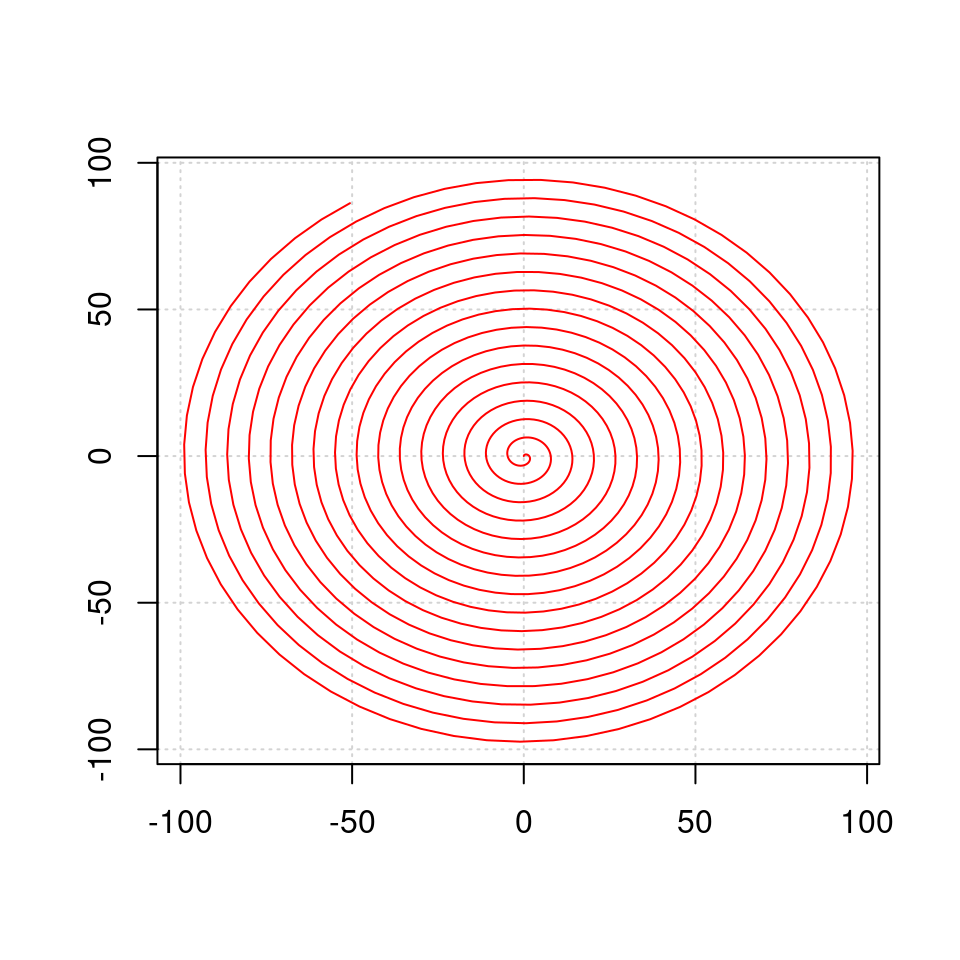
FUN(seq(from = 0, to = 200, by = 0.1))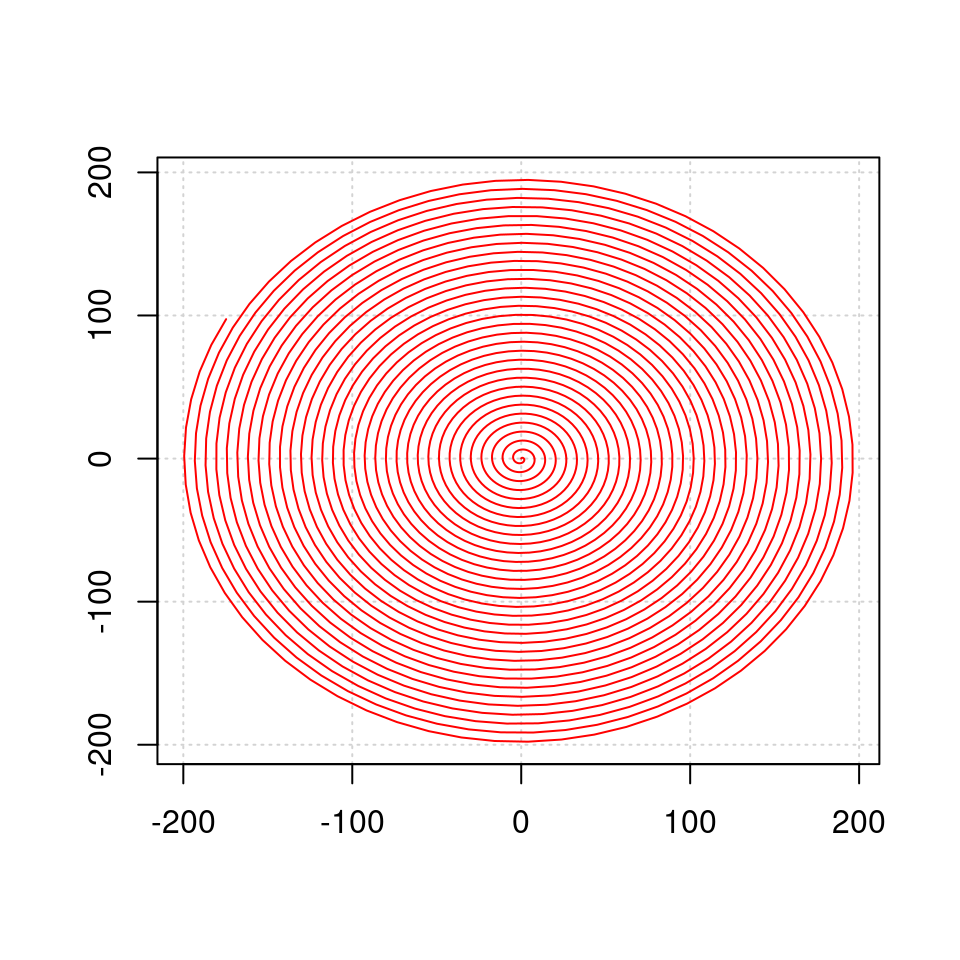
Answer: click to reveal
We can write the function as follows:
FUN <- function(x) plot(cbind(x * sin(x), x * cos(x)), type = "l", panel.first = grid(), ann = FALSE, col = "red")This definition uses the functions cos and sin to plot a spiral with the origin at 0 and also adds grid lines consistent with the axis ticks:
FUN(seq(from = 0, to = 20, by = 0.1))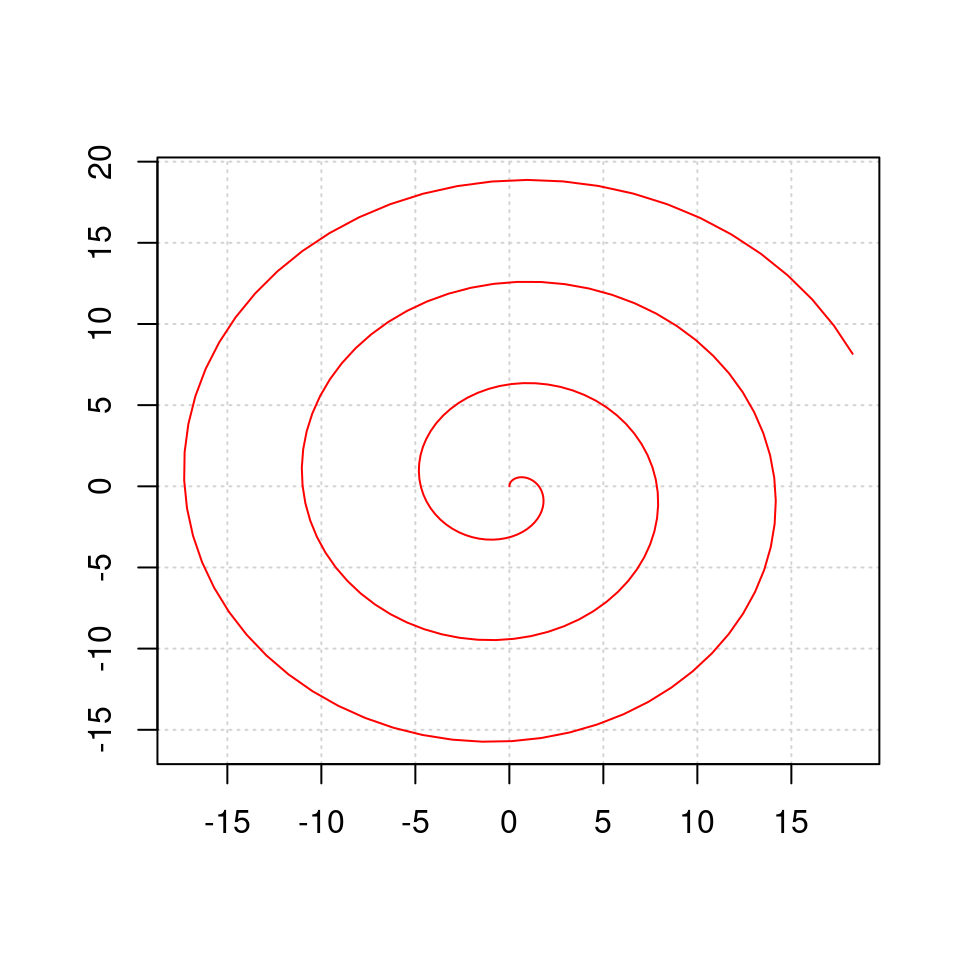
For a full collection of R programming tutorials and exercises visit my website at codeRtime.org and the codeRtime YouTube channel.